Table 1. Public Yelp Dataset Statistics
| City |
Year |
#Review |
#Check-in |
| Las Vegas |
2013 |
148,371 |
962,717 |
| 2014 |
217,579 |
1,028,731 |
| 2015 |
284,881 |
1,042,245 |
| 2016 |
324,064 |
945,062 |
| 2017 |
359,982 |
839,641 |
| Totonto |
2013 |
43,773 |
113,289 |
| 2014 |
57,664 |
116,554 |
| 2015 |
77,859 |
137,310 |
| 2016 |
85,561 |
136,932 |
| 2017 |
88,338 |
130,724 |
Table 2. Hyper-parameter Setting
| Key |
Value |
| optimizer |
Adam |
| lr |
0.001 |
| beta_1 |
0.9 |
| beta_2 |
0.9 |
| epsilon |
1e-08 |
| decay |
1e-06 |
Table 3. Comparison of Different Methods
| Method |
MSE |
MAPE |
| HA |
53.79 |
22.98 |
| ARIMA |
61.76 |
21.92 |
| XGBoost |
28.68 |
22.15 |
| Our Method |
26.25 |
16.20 |
| Our Method without periodic deminsion |
27.50 |
17.47 |
| Our Method without residual network |
567.70 |
100.00 |
Fig 1. Comparison of DSTRN with different parameters
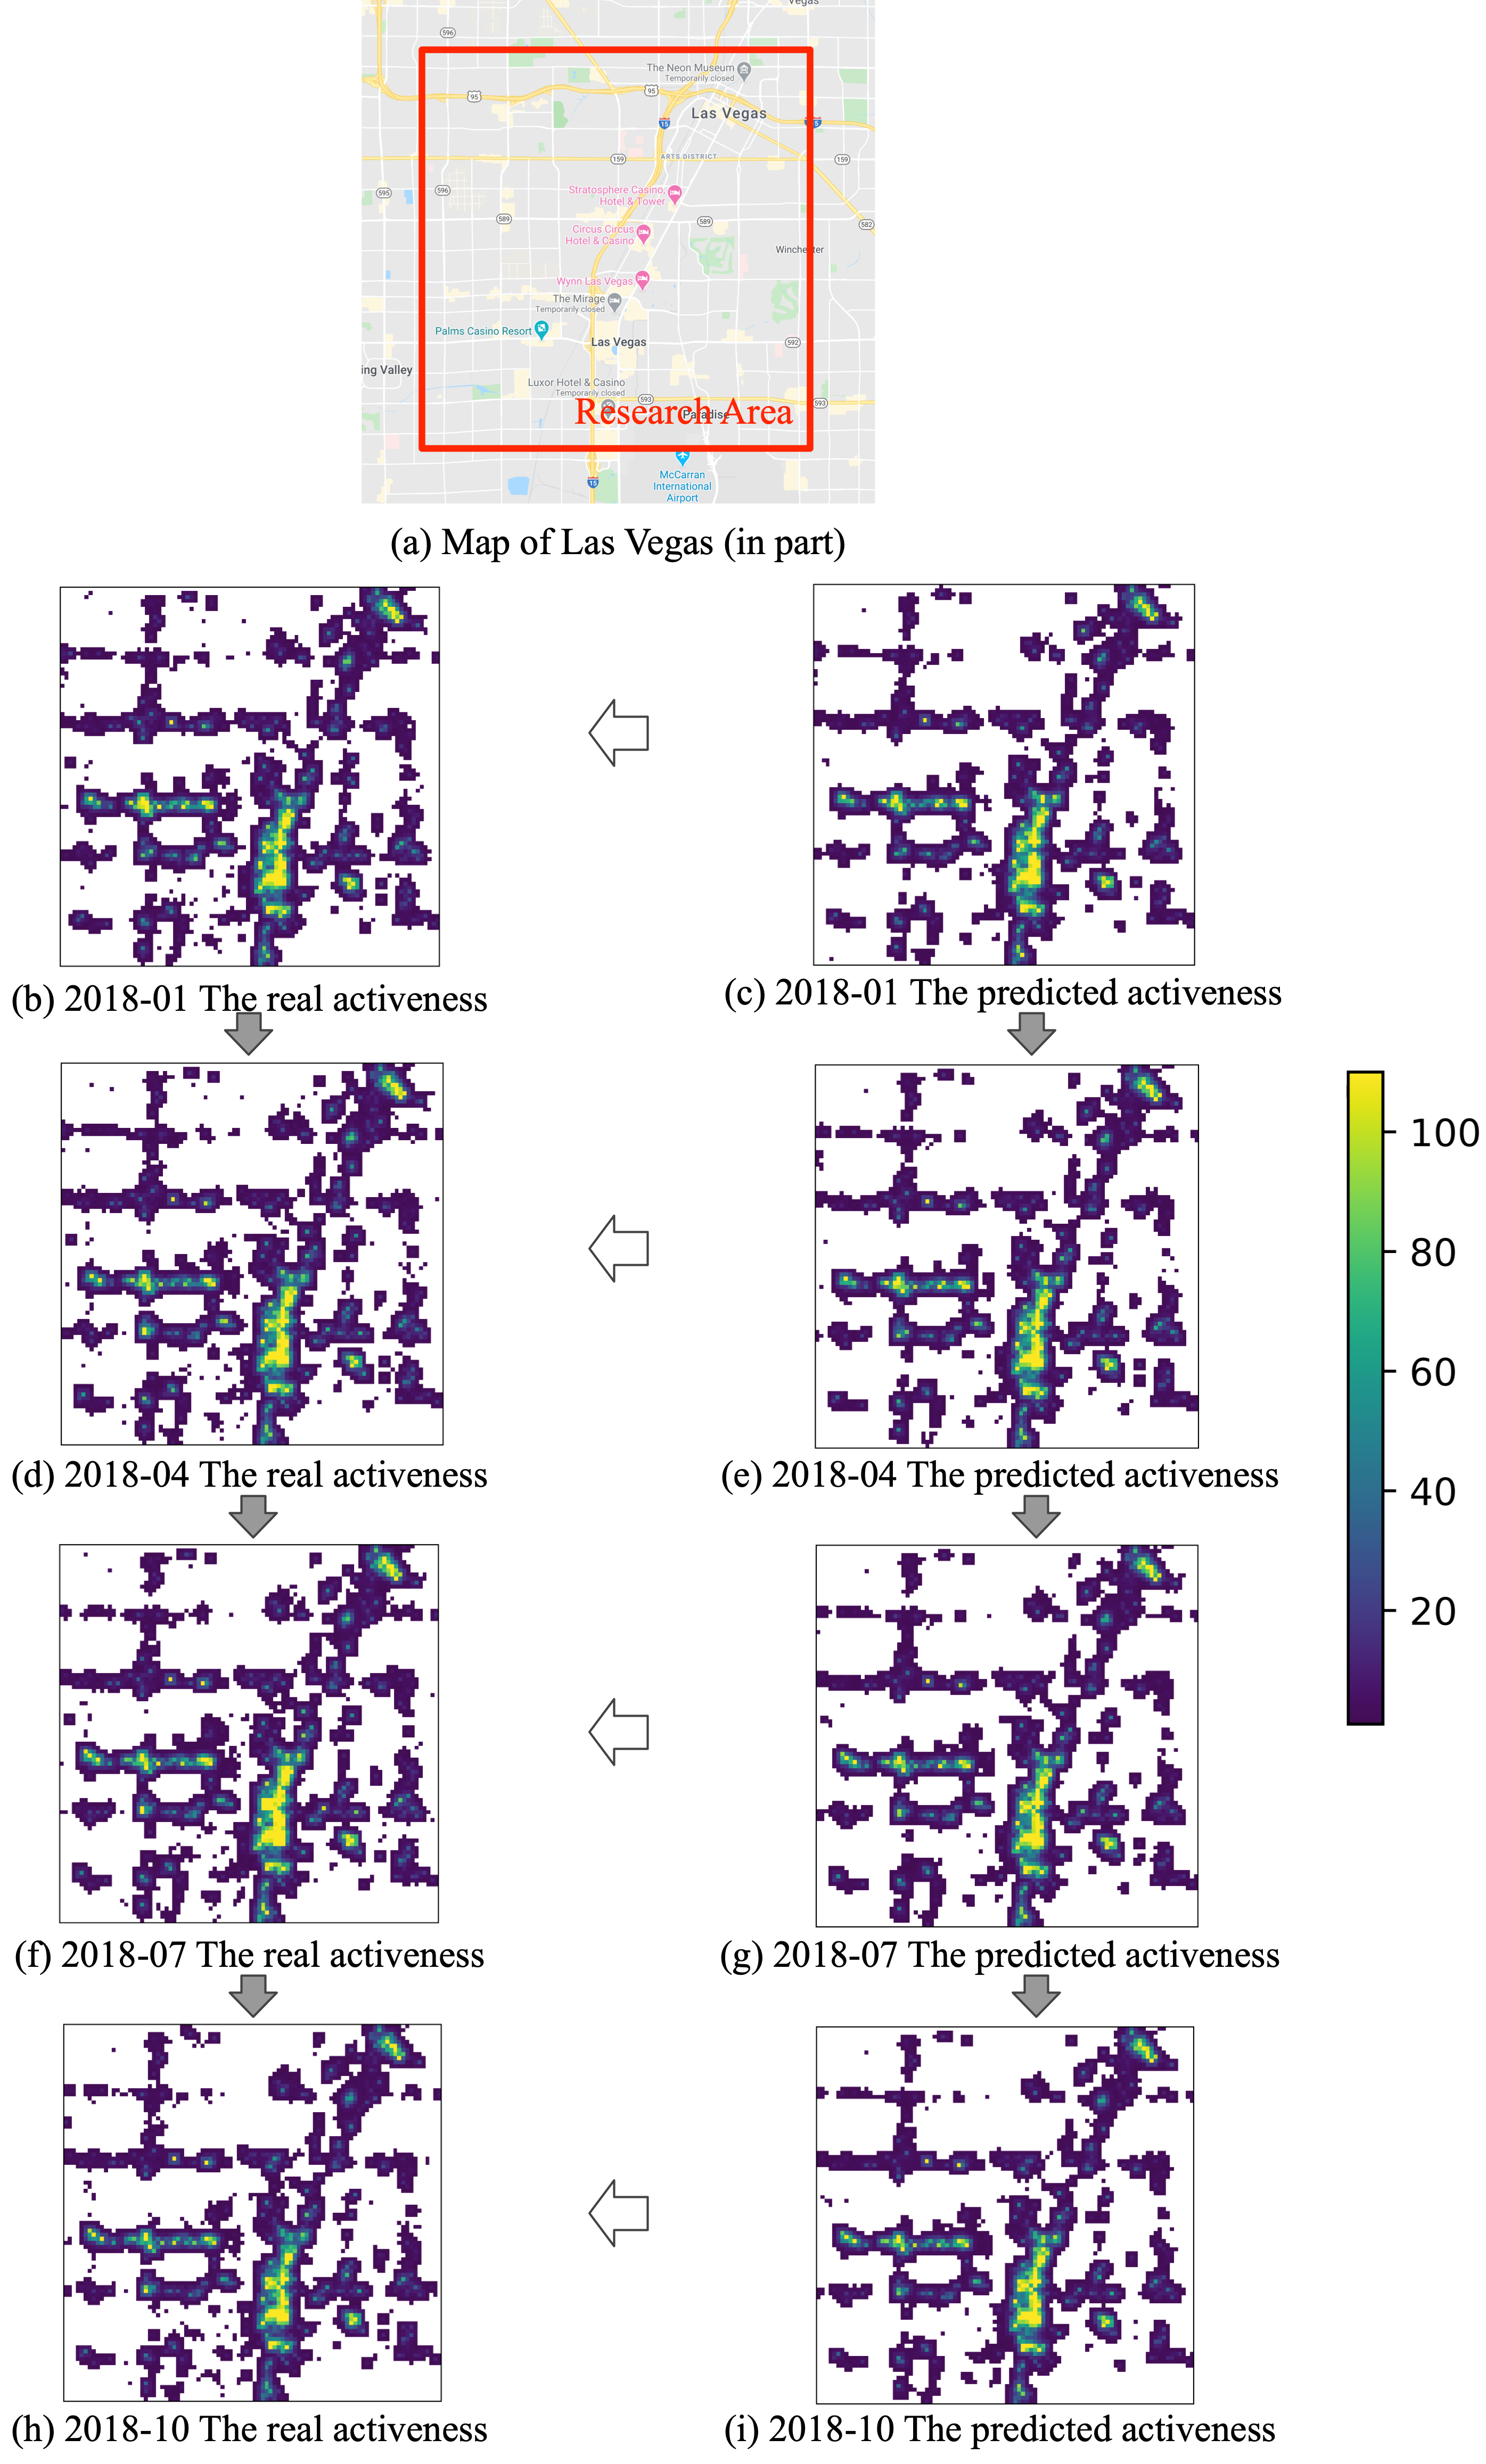
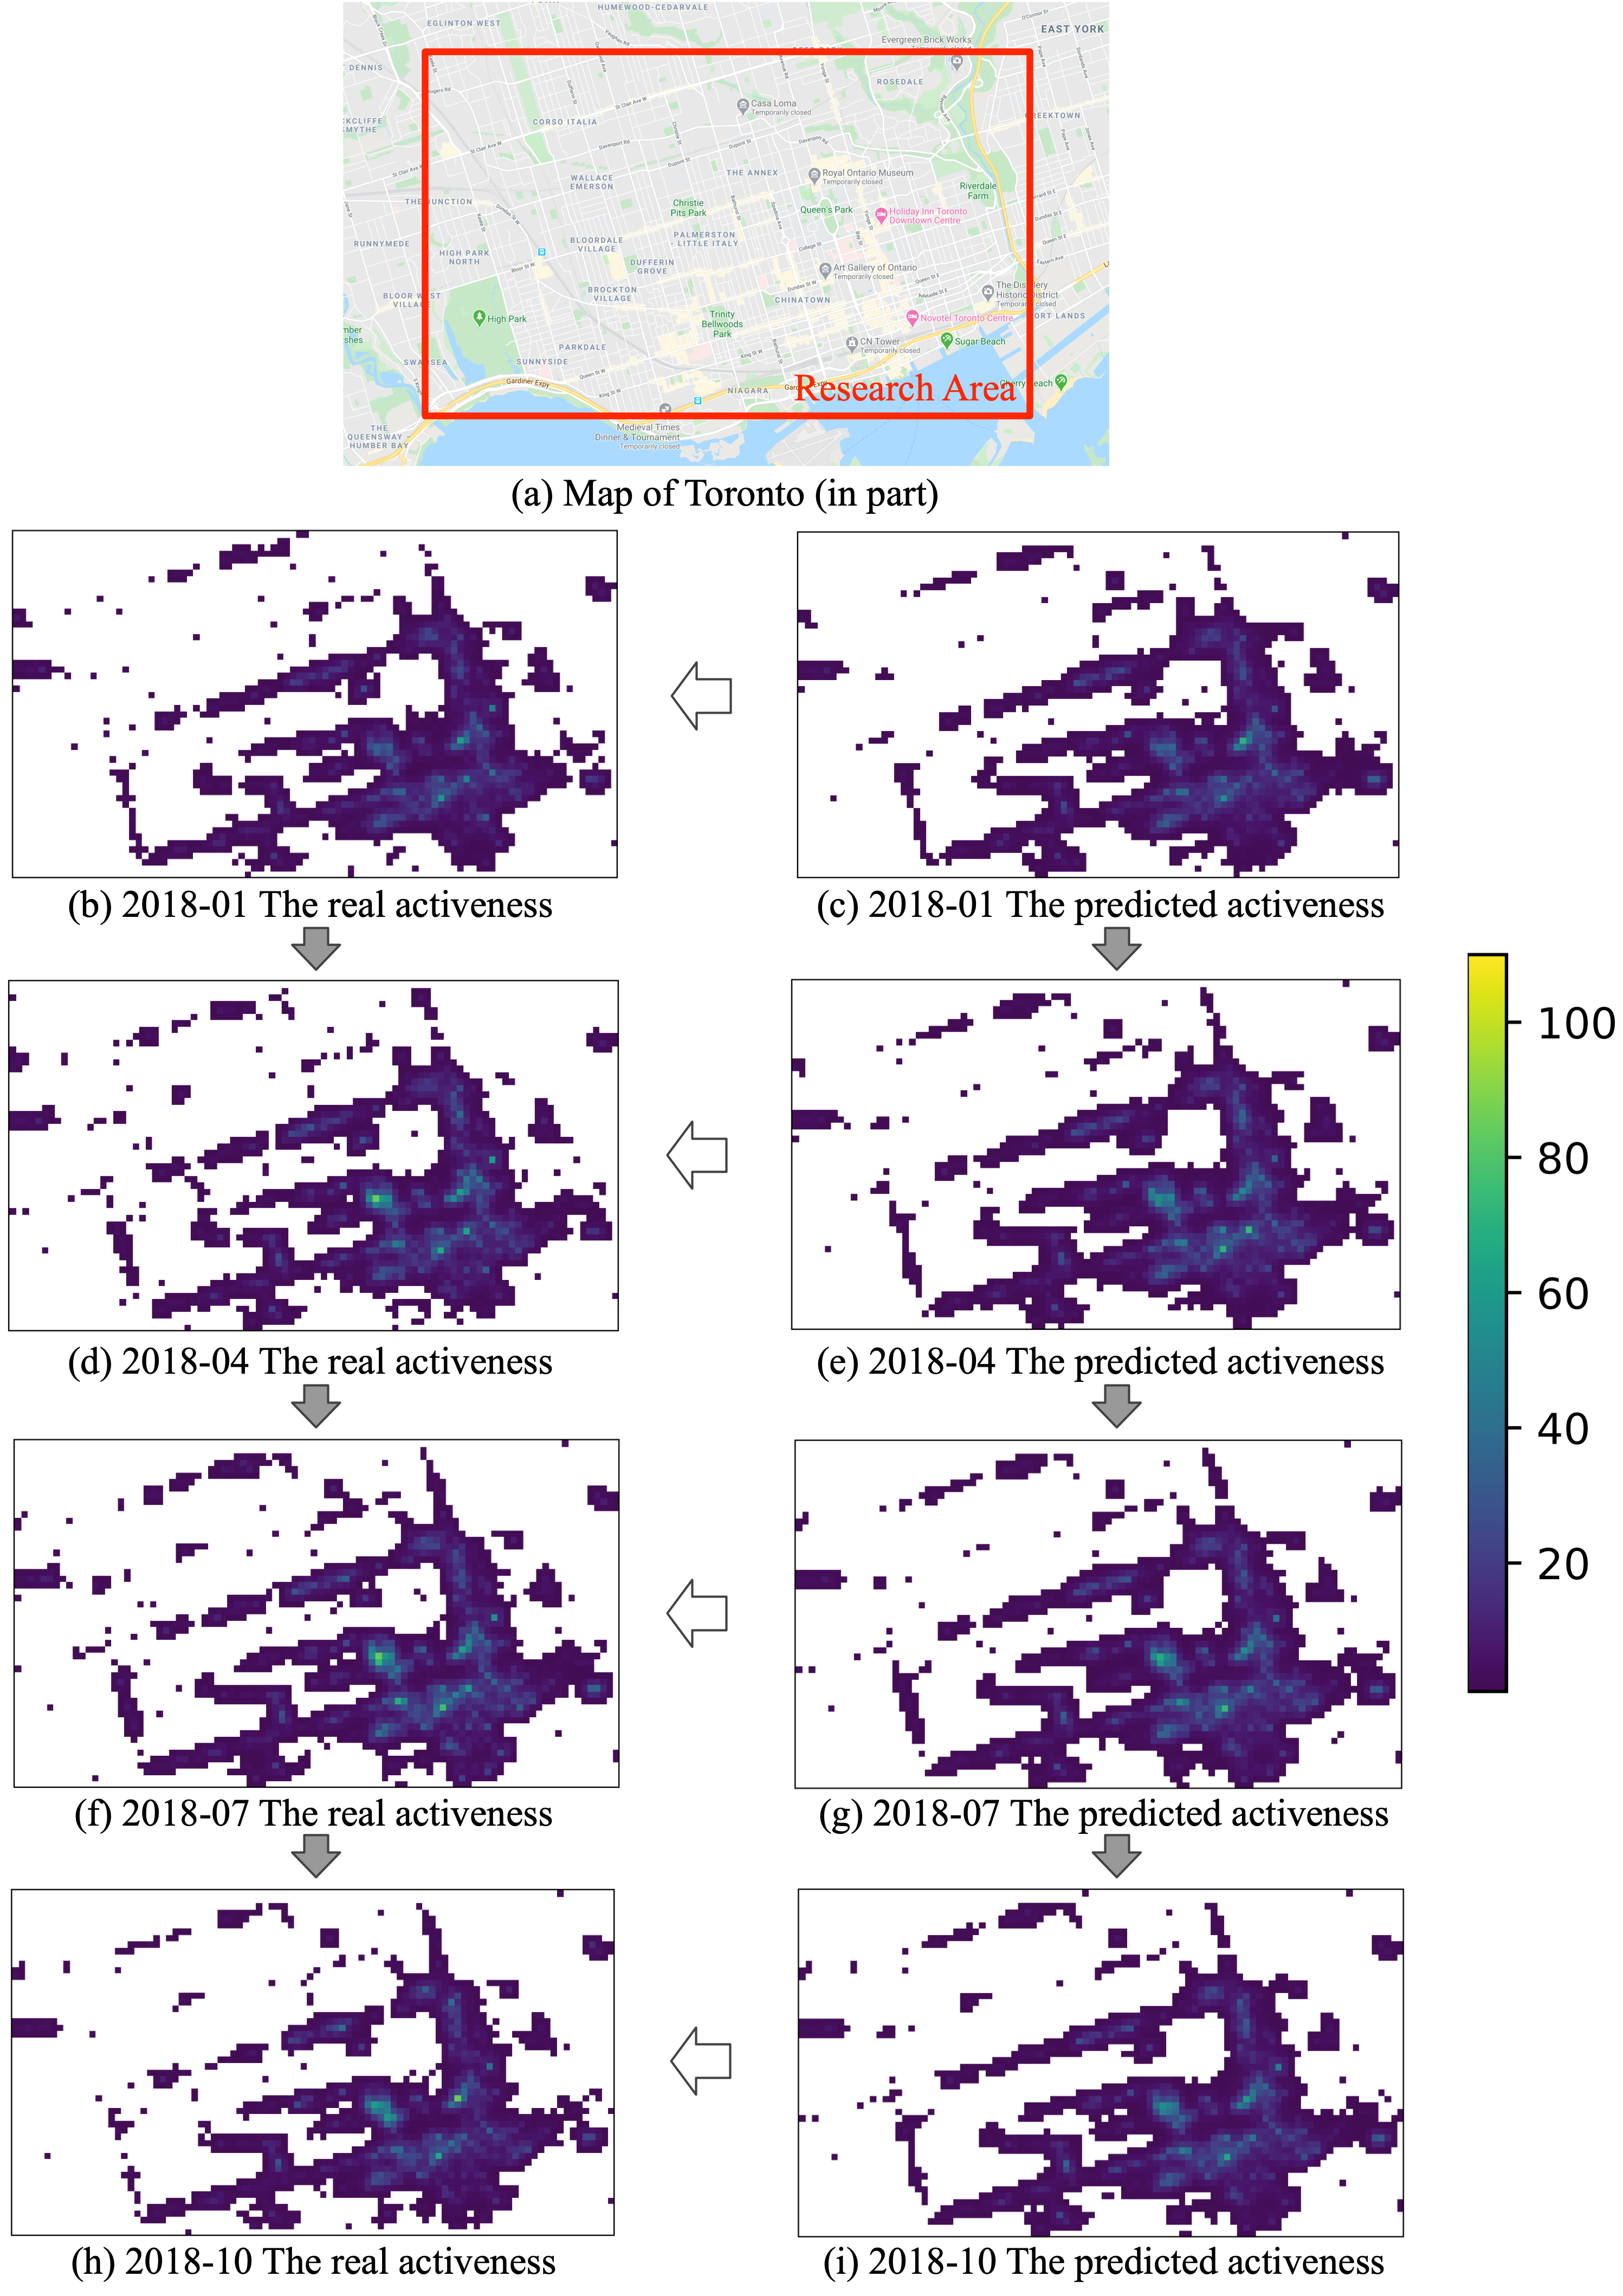
Fig 2. Visualization resluts of real and predicted activeness of Las Vegas and Toronto in 2018
Las Vegas
Toronto